%20scilla.studio.svg)

A good 90-day retention rate is roughly 25% to 35% for B2B SaaS and 1% to 4% for consumer apps. Yes, those two numbers really are an order of magnitude apart, because they measure different things about different products. D90 is the metric that tells you whether you built something people keep coming back to, or just something they tried once. But the single number lies more than almost any other retention metric, and below I'll show you exactly where.
90-day retention (D90) is the percentage of a cohort still active 90 days after they first signed up or used the product.
D90 retention = (users active on day 90) / (users in the original cohort)
If 1,000 people activated in March and 280 of them are still active in June, your D90 is 28%.
Day-1 and Day-7 retention tell you whether onboarding worked and whether the first session delivered. They're early signals, useful but cheap to game with a good welcome flow and a push notification. D90 is harder to fake. By three months in, the novelty is gone, the onboarding nudges have stopped, and the discount that got someone in the door has expired. What's left is the answer to one question: does this product still earn a place in someone's week?
Here's the interesting part: D90 is the retention metric that most directly maps to lifetime value. A user who survives to day 90 has, in almost every product category, crossed into the flat part of the retention curve: the cohort that stops decaying and becomes your durable revenue base. That's why D90 is the long-term value signal, and why investors and operators look at it before almost any acquisition metric. (For the full picture across D1, D7, D14, and D90, see the retention rate benchmarks pillar. This article is the deeper cut on the 90-day number specifically.)
These are industry-average bands. Treat them as context, not targets; more on why in the next section.
| Product type | Good D90 retention | What it means |
|---|---|---|
| B2B SaaS / B2B tools | 25% to 35% | Share of an activated cohort still active at day 90. |
| Consumer apps | 1% to 4% | Share of a signup/install cohort still active at day 90. |
For B2B, below 20% at day 90 is a red flag: it usually means the product never embedded into a recurring workflow. For consumer apps, the bands look tiny by comparison, but anything above 5% is exceptional.
Sources: B2B SaaS 25% to 35%, Pendo Product Benchmarks; consumer apps 1% to 4%, AppsFlyer and Adjust mobile retention data.
Don't read those two rows as "B2B is ten times better than consumer." They're different games. A B2B tool is bought to do a job that recurs every week (invoicing, deployment, support tickets), so the people who adopt it tend to keep using it because the job keeps coming back. A consumer app competes for discretionary attention against every other app on the phone, and most lose. A 3% D90 that would be a catastrophe for a SaaS tool can be a perfectly healthy number for a consumer app. Compare yourself to your own category, never across the line.
For a B2B product, D90 is really a proxy for whether you've embedded into a workflow. The 25% to 35% band assumes a self-serve or product-led motion where individual users activate and either stick or churn. A few things bend it:
In my honest, experience-earned opinion: if your B2B D90 is below 20%, no growth tactic will save you. That's a product-market fit problem, not a marketing problem, and it's worth reading what product-market fit actually is before you spend another krona on acquisition.
Consumer retention falls off a cliff and then, if you have a real product, flattens into a small, loyal core. The whole game is the flattening, not the height. A consumer app that retains 4% at day 90 but holds that 4% flat for a year has a far better business than one retaining 8% at day 90 that keeps decaying toward zero. The retention floor is what compounds into LTV.
For category-specific consumer context, see the consumer app benchmarks. For the B2B equivalent with unit economics attached, the B2B SaaS growth benchmarks.
This is the part most benchmark guides skip, and it's the part that actually changes decisions.
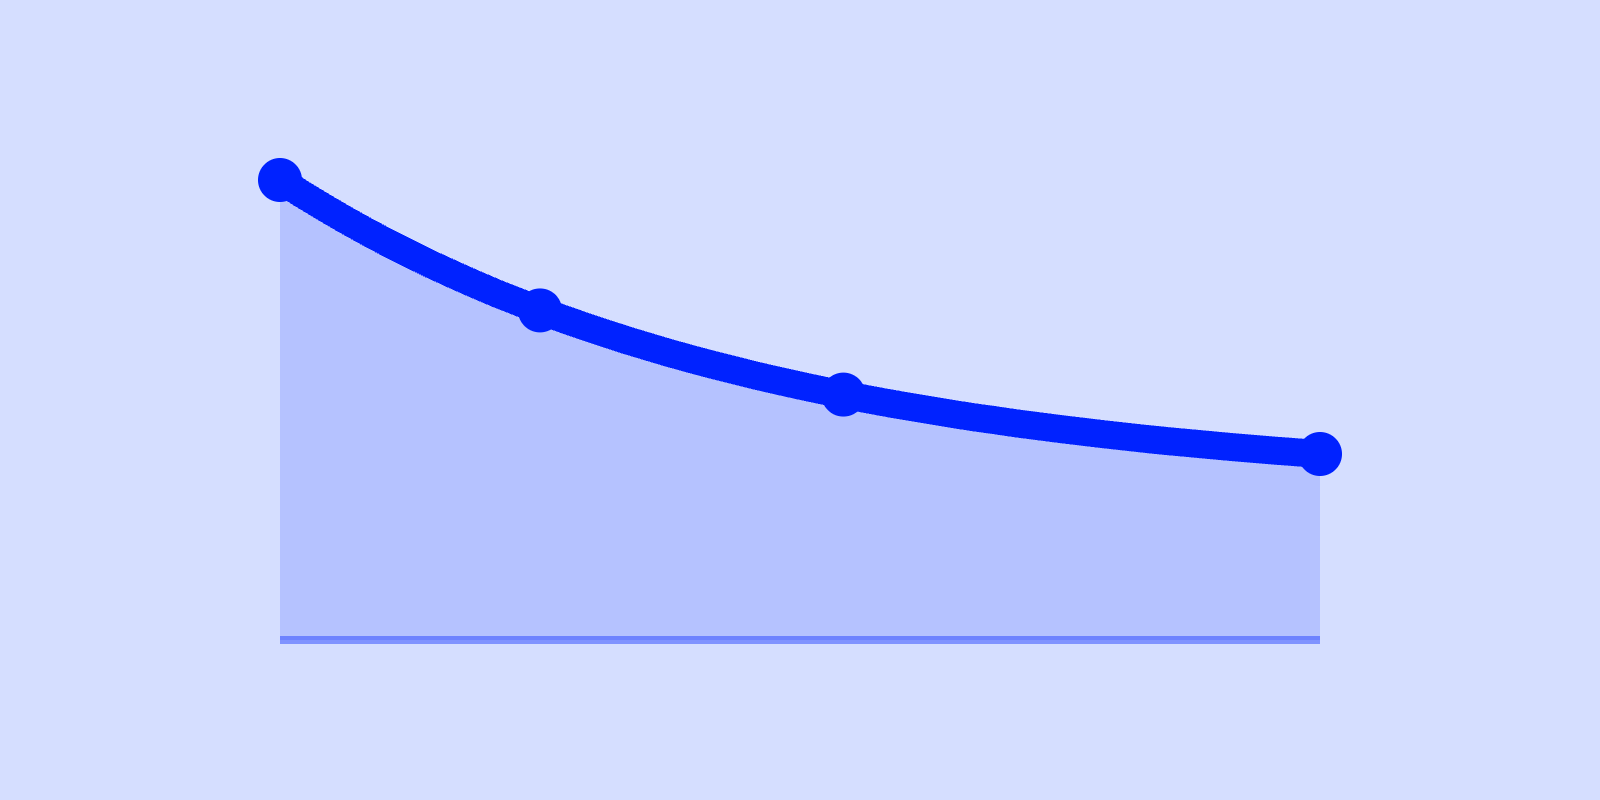
The shape beats the number. D90 is one point on a curve. What you really want to know is whether the curve has flattened by day 90 or is still sliding. Two products can both show 28% at day 90: one arrived there and held, the other is dropping a point a week and will be at 15% by day 120. The first has product-market fit. The second will keep decaying. Always look at the curve, not the snapshot.
The healthier product is the one whose curve went flat, every time. A flat tail is the signal that you've found the users for whom this product is genuinely habitual. That subset is your real business; everyone above the floor was just trying it out.
The cohort definition decides the number. D90 is brutally sensitive to who you count. Measured from signup, it includes everyone who bounced after the first screen, which drags it down. Measured from activation (users who hit the product's core value at least once), it's much higher and much more meaningful. Neither is wrong, but comparing your activation-based D90 to a benchmark built on signup-based cohorts is comparing apples to a different orchard. Know which one you're holding.
D90 interacts with everything downstream. A strong D90 is what makes a long CAC payback period survivable: if users stick for years, you can afford to take a year to earn back acquisition cost. It's also the engine behind a healthy LTV:CAC ratio, because lifetime value is just retention integrated over time. A great D90 with poor monetization still leaves you with no business, and a great LTV:CAC that secretly rests on a decaying retention tail is a mirage. The numbers only mean something together.
D90 is a lagging indicator. You can't move it directly; you move the things that produce it. The honest levers:
None of these is a growth hack with a guaranteed delta. Anyone promising you a fixed "+10% D90 in 30 days" is selling you something. Long-term retention is the slow, unglamorous result of building something people actually need repeatedly.
The free Scilla benchmark tool charts your retention curve against the B2B and consumer bands (D1 through D90), so you can see not just your 90-day number but the shape of the whole curve and where it flattens, in a couple of minutes. Benchmarks are context, not a target; the tool is built to give you the context fast.
What is a good 90-day retention rate? For B2B SaaS, roughly 25% to 35%; below 20% is a warning sign. For consumer apps, 1% to 4%, with anything above 5% considered exceptional. The two should never be compared directly, because they're different growth mechanics.
Why is B2B 90-day retention so much higher than consumer? B2B tools are bought to do a recurring job, so adopters keep coming back because the job recurs. Consumer apps compete for discretionary attention against everything else on the device, and most lose. A 3% D90 can be a failure for SaaS and a success for a consumer app.
Is D90 retention measured from signup or activation? Either, but they produce very different numbers. Signup-based cohorts include everyone who bounced immediately and read lower; activation-based cohorts read higher and are usually more meaningful. Always confirm which definition a benchmark uses before comparing.
What's more important: the D90 number or the retention curve? The curve. Two products at the same D90 can be on completely different trajectories: one flattened and holding, one still sliding toward zero. A flat tail signals product-market fit; the absolute number alone doesn't.
How does D90 retention relate to LTV? Lifetime value is essentially retention integrated over time, so D90 (your durable retention floor) is the single biggest input to LTV. A strong D90 is also what makes a long CAC payback period survivable and a healthy LTV:CAC ratio real rather than a mirage.


