Free Product Growth Benchmark Calculator (B2B & Consumer)

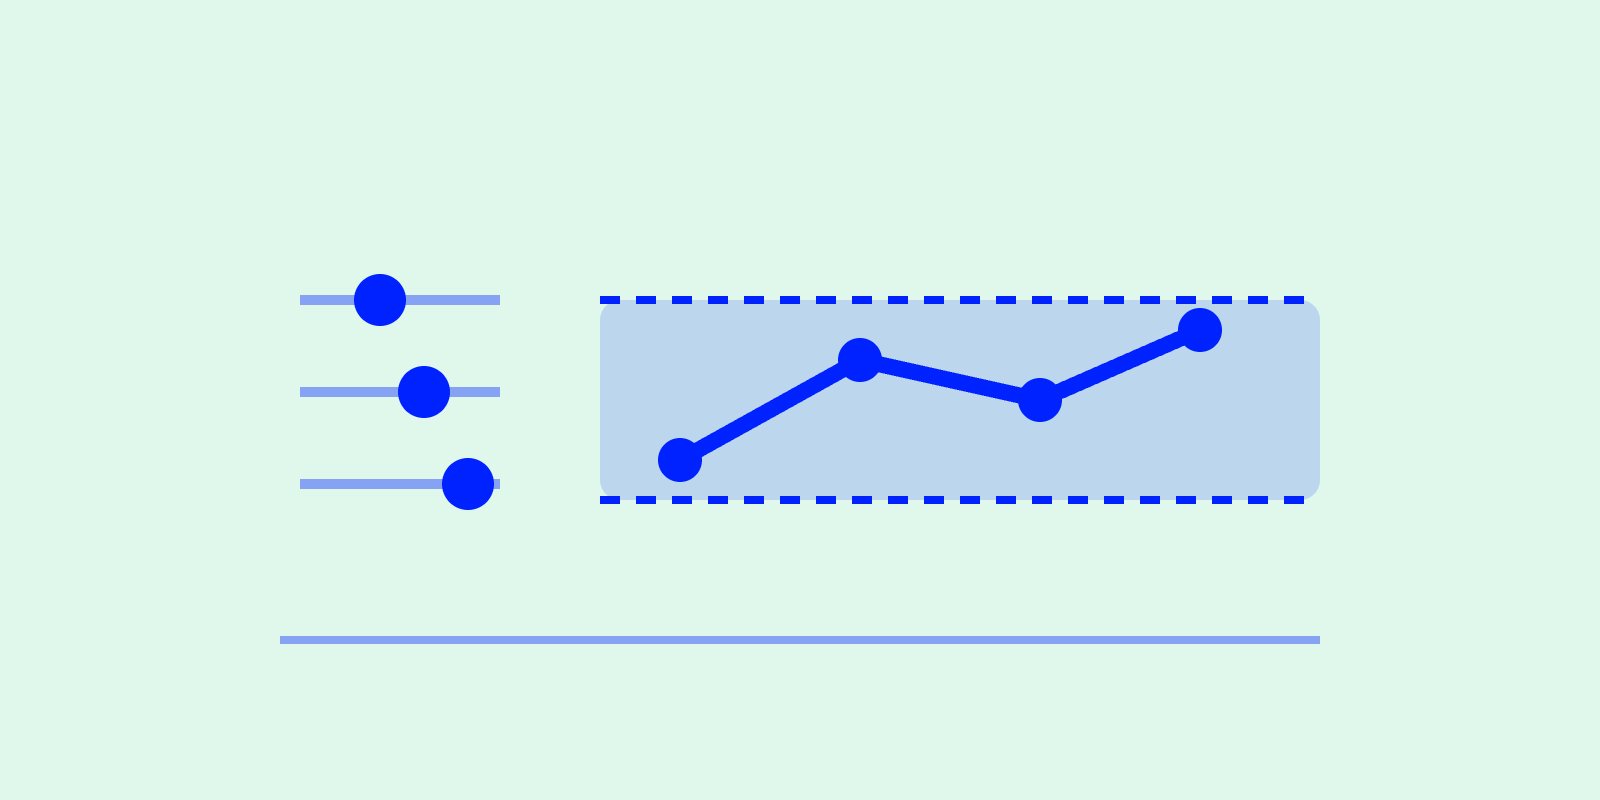
Yes. The free growth benchmark calculator at benchmark.scilla.studio charts four metrics against B2B SaaS and consumer ranges. The four are retention at Day 1, 7, 30 and 90, K-factor, LTV:CAC and CAC payback. It needs no signup and no sales call.
Every range names its source (Amplitude, Mixpanel, Bessemer, OpenView, a16z, Adjust, AppsFlyer, Reforge, Andrew Chen) or says when a figure is an estimate. The tool shows which of the five metrics sits below its range.
What is a growth benchmark, and is it a target?
A growth benchmark is the average range a metric falls into for products like yours, not a goal line. Used right, it shows where you stand and which number is off. Used wrong, it becomes a target you chase past the point of usefulness.
Our free growth benchmark calculator charts retention, K-factor, LTV:CAC and CAC payback against sourced B2B SaaS and Consumer ranges.
What the calculator does
You enter the numbers you already have: last month’s new users, monthly active users, a few retention points and your unit economics if you have them. The tool plots them against the average range for your product type. Metric by metric, it shows where you land: inside the range, above it or below it.
It is a directional read on four growth metrics, side by side, with the sources visible. It stops short of a verdict.
The most useful output is which metric is below benchmark. Weak Day-7 retention and weak LTV:CAC are very different diseases with very different fixes.
The four metrics it benchmarks
The ranges shown are the ones the tool uses.
Retention
Retention here is cohort retention: the percentage of everyone who signed up still active after a given number of days.
| Metric | B2B SaaS (cohort retention) | Consumer apps (cohort retention) |
|---|---|---|
| Day-1 retention | 5 to 25% (estimate) | 20 to 30% |
| Day-7 retention | 4 to 20% (estimate) | 8 to 15% |
| Day-14 retention | 3 to 18% (estimate) | 4 to 8% |
| Day-90 retention | 2.5 to 15.6% (Amplitude) | 1 to 4% |
Sources: Amplitude B2B Technology Product Benchmarks (B2B Day 90; Day 1 and Day 7 are estimates); Adjust, AppsFlyer, Amplitude, Mixpanel, Statista (consumer). Pendo’s returning-user rates (50 to 70% Day 1, 40 to 60% Day 7, 25 to 35% at 90 days) measure something else and are not comparable.
The two product types differ in the shape of the curve and in what counts as active. That is why the calculator makes you pick a product type first. (More on each range in retention rate benchmarks and why B2B and Consumer don’t compare.)
K-factor (viral coefficient)
K-factor is your viral multiplier: how many additional users each new user generates before their influence runs out. K = 0.5 means two users bring one more. K > 1 is true viral growth.
| B2B SaaS | Consumer apps | |
|---|---|---|
| K-factor | 0.1 to 0.3 | 0.3 to 0.7 (rarely >1) |
Sources: Reforge, Andrew Chen. Anything above 0.3 is unusually strong unless the product has built-in collaboration loops. Even a Consumer K of 0.5 counts as very strong. If your number looks suspiciously high, the most common cause is counting invitations that did not convert. (How to lift K-factor without bolting on a referral program.)
LTV:CAC ratio
LTV:CAC compares the lifetime value of a customer to what it costs to acquire one.
| B2B SaaS | Consumer apps | |
|---|---|---|
| LTV:CAC | 3:1 to 5:1 | 2:1 to 4:1 (ideal ≈3:1) |
Sources: Bessemer State of the Cloud, OpenView SaaS Benchmarks, a16z (B2B); Adjust, AppsFlyer, a16z (Consumer). Roughly 3:1 is the minimum healthy baseline. Below 2:1 is structurally risky. A ratio above 5:1 often means you are underinvesting in growth. (Why a great LTV:CAC can come with flat growth.)
CAC payback period
CAC payback is how many months of margin it takes to earn back the cost of acquiring a customer. A healthy LTV:CAC with a brutal payback period can still starve you.
| B2B SaaS | Consumer apps | |
|---|---|---|
| CAC payback | 6 to 12 months (SMB/self-serve), 12 to 24 months (enterprise) | 1 to 6 months |
Sources: OpenView, KeyBanc SaaS Survey (B2B); AppsFlyer, Mobile Dev Memo (Consumer). Under 12 months is strong for B2B. Longer payback is only acceptable with very high retention and expansion. Past six months, most fail at scale. (What to do when payback is too long.)
Activation, which the tool no longer grades
The tool used to grade activation and onboarding completion. An audit in June 2026 found no published range that matched ours.
The only onboarding-completion figures (Userpilot, a vendor sample) sat two to four times below. Activation depends so much on each company’s own definition that no range survived. The full reasoning is in where the benchmark numbers come from.
How to read your result without fooling yourself
The temptation is to chase whichever reading is red. Resist it, in this order:
- Read retention before economics. A great LTV:CAC built on a leaking bucket is a timing problem.
- Look for the curve flattening, more than the absolute number. A Day-14 number that’s “below benchmark” but flat from Day-7 is often healthier than a higher number still falling off a cliff.
- Don’t compare across product types.
- A range is a range, not a line. Landing at the bottom of a range isn’t failing. Your business model (freemium, self-serve, enterprise) changes what “good” looks like.
The metrics also interact. K-factor and retention compound: if users churn fast, every viral loop gets fewer chances to fire before the user leaves. (The cohort model behind the charts walks through that math.)
Why we keep the sources visible
We show sources because a benchmark you can’t trace is a rumor with a number attached.
Where we have no clean source (the activation ranges above, and the B2B Day-1 and Day-7 retention estimates), we say so.
Use the calculator
Open the free growth benchmark calculator →
Enter last month’s new users and MAU, a few retention points, and your unit economics if you have them.
If you want the methodology before you trust the output, start with how to benchmark startup growth.
Frequently asked questions
See where your numbers actually land
Plot your retention, CAC payback, LTV:CAC and K-factor against the B2B and Consumer bands, and find out whether a good-looking number is real or sitting on a leaky retention curve.
Run the growth diagnostic →